Are fewer people really identifying as trans and non-binary? The truth behind the questionable data

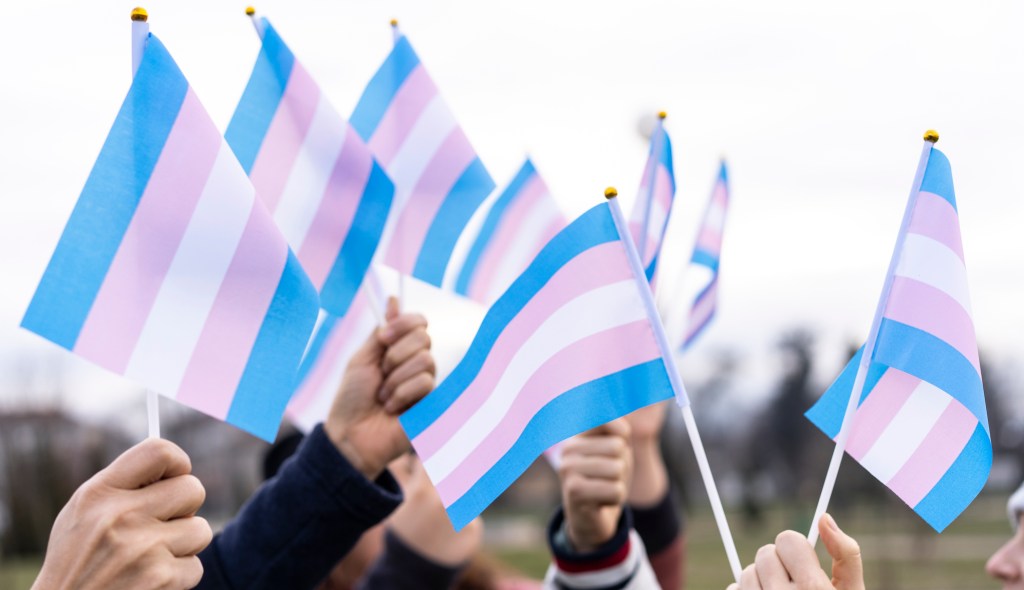
No, trans people haven’t just suddenly disappeared. (Getty)
Conservatives are claiming that a recent survey on the number of people “identifying” as transgender proves that they are a myth.
Earlier this month, anti-trans and so-called gender-critical activists began sharing research that supposedly showed the number of people identifying as trans or non-binary had dropped noticeably over the past few years.
A graph, supposedly used to track the number of US citizens aged between 18 and 22 who identifed as trans or non-binary from 2021 to 2024, was created by American professor of psychology Jean Twenge, in response to claims by right-wing academic Eric Kaufmann that “trans identification is in free fall among the young”.
In a post on X/Twitter post earlier this month, Kaufmann shared “analysis” that he claimed showed fewer people were publicly identifying as trans. But the research was challenged by journalist Erin Reed, who said it contained “a massive statistical error” by ignoring binary trans people.
It turns out … trans identification really is in free fall among the young. So is nonbinary identity. See below from a nationally representative survey (the CES). @epkaufm was right. 🚨👀 (1/2) 👇 pic.twitter.com/q2W2ZTFunJ
— Jean Twenge (author of 10 RULES, GENERATIONS) (@jean_twenge) October 20, 2025
In an attempt to show whether Kaufmann’s claims were correct or not, Twenge analysed research from the Cooperative Election Study (CES), a national online survey conducted before and after US presidential and midterm elections.
She claimed in a Substack post on 20 October that “identifying as transgender really is in free fall among the young in the US”, saying Kaufmann “was right (with what some consider the wrong data, but still right)”.
Twenge told Fox News the data could be the result of “changes in acceptance” which, she said, would mean “more young adults identified as transgender and/or were willing to identify as transgender in a survey”.
However, others have called the data into question, with some claiming it misinterpreted the CES figures.
Are fewer people ‘identifying’ as trans?
Twenge’s graph showed that the number of respondents who said they identified as transgender fell from around 4.5 per cent in 2023 to three per cent in 2024, while the number of non-binary people dropped from five per cent to just two per cent.
Comparing the results to similar surveys already raises red flags. Gallup polls from 2022 onwards have suggested that the number of trans adults has actually been steadily increasing, with the percentage of the number in the US population rising from 0.7 in 2022 to 0.9 last year.
It was also claimed that the number of 18 to 22 year olds identifying as trans peaked in 2022 at six per cent. Figures from the Pew Research Center in the same year, however, suggested that just two per cent of 18-29 year olds publicly identified as trans, while three per cent identified as non-binary.
Studying the figures, activist James Billingham noted his results for the 2024 survey varied greatly from Twenge’s. Under his analysis, the number of trans people in 2024 rose from three per cent to 4.5 per cent, while the number of non-binary people rose from two per cent to 3.5 per cent.
In addition, he questioned the decision to limit the age range, given that 18 to 22 year olds constituted slightly more than 3,000 of the data’s 60,000 sample size.
Others said the lack of error bars to address the difference in sample sizes was also a concern.
In its question, “are you transgender,” in 2024, the CES gave respondents three options: yes, no and prefer not to say. Twenge did not clarify how or whether those who chose the third option were incorporated into her study.
Furthermore, the survey’s question on gender identity gave respondents four possible answers: male, female, other, and prefer not to say. Again, Twenge did not elaborate on how or whether the latter categories were incorporated into her results.
The data also said nothing about long-term trends. While the graph covered three years of survey data – none was collected in 2023 – the results were “weighted” by Twenge; the dip spans just two years.
What could the figures be telling us?
Regardless of the data’s accuracy, it doesn’t suggest that trans people are the result of a “fad” or “social contagion”.
The CES data did not report the number of people who are transgender, it reported the number of people who felt comfortable enough to publicly identify as such.
If the drop was as significant as Twenge and others claimed, then this didn’t suggest that trans people suddenly decided to hang up their pink, blue and white hat and detransition, it could simply mean something was making them feel less confident in outing themselves.
While this could be for any number of reasons, it’s worth acknowledging that this claim was being made at a time when western nations are becoming worse places for publicly out trans people to live.
While Gallup noted in July that 54 per cent of Americans believed that changing gender was “morally unacceptable,” in August, the FBI reported that 20 per cent of all hate crimes were motivated by anti-LGBTQ+ bias.
Just a month later, the White House said it was considering brandind so-called trans extremism a form of domestic terrorism.
The Human Rights Campaign has said that on average one in every 10 transgender people had been physically assaulted in their life time, while 47 per cent had suffered sexually assault.
Politically, trans people have become a punching bag for right-wing and anti-LGBTQ+ politicians, including Donald Trump. At least 616 anti-LGBTQ+ bills have been proposed in US states since January this year alone. More than 500 homophobic bills have been proposed every year since 2023.
Similar phenomena has occurred within other groups, notably in a survey for The Washington Post on the history of left-handedness.
A graph, which analysed the number of left-handed people in the US between 1880 and 2000, showed a dip between the 1800s and 1920s, before the number of people “identifying” as left-handed increased.
Rather than there being some form of social contagion around southpaws, the graph instead highlighted how the stigma of being left-handed in the late Victorian era caused people to hide their true selves for fear of discrimination.
As one person put it in response to Twenge’s conclusions: “Young people, who feel they might be killed for who they are, decline to tell people who they are.”
Share your thoughts! Let us know in the comments below, and remember to keep the conversation respectful.