US states with the highest and lowest proportion of same-sex couples revealed

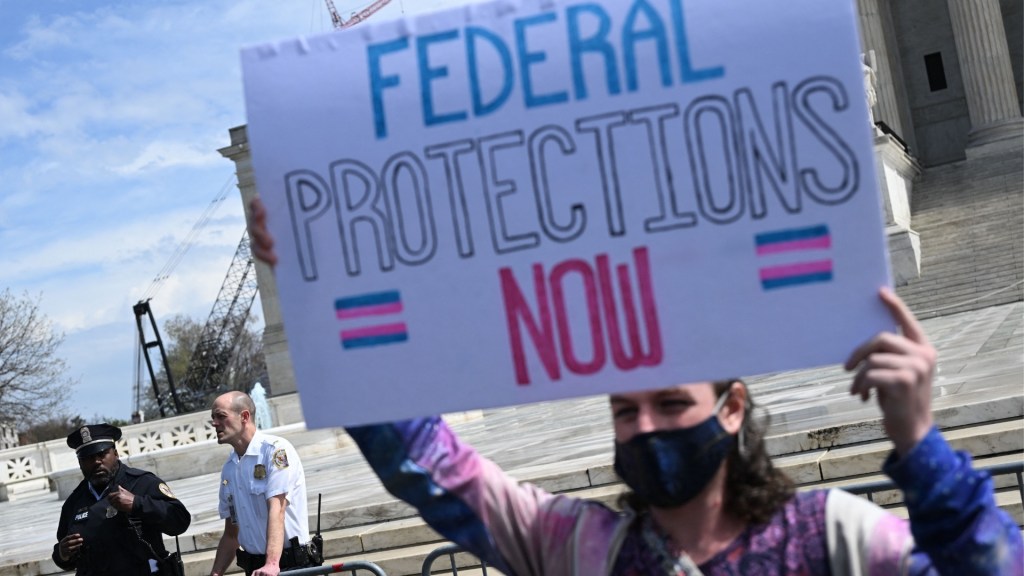
The proportion of same-sex couples living in each US state has been revealed. (Canva)
The US states with the highest – and lowest – proportion of same-sex couples living there have been revealed.
A snapshot of the 2020 census by the Williams Institute found that there were 1,168,566 same-sex couples living together in the US.
The majority of same-sex couples cohabiting were found to be female (53.4 per cent), while 47.7 per cent of men were noted to be living together. A majority of 57.7 per cent of the total same-sex couples cohabiting are married, while 22.1 per cent of those married couples are raising their own children.
The snapshot further highlights the US states with the highest and lowest proportions of same-sex couples, which, unsurprisingly, tend to be red states.
Coming in on top as the area with the highest proportion of same-sex couples cohabiting is the District of Columbia, which despite not being a state has 25.7 same-sex couples for every 1,000 households, amounting to 8,052 same-sex couples in total.
Delaware, home to trans senator Sarah McBride, follows behind with 12.61 same-sex couples for every 1,000 households, amounting to 4,873 same-sex lovers, while Oregon, where state law allows trans students to compete in sex-segregated sports teams, has 12.56 couples for every 1,000 households, amounting to 21,006.

The progressive state of Vermont has 12.41 couples for every 1,000 households, amounting to 3,373, while Nevada has 12.32, amounting to 14,504.
Hawaii also has 12.32 couples for every 1,000 households, amounting to 6,038, while Massachusetts has 12.17, amounting to 33,452.
California has 12.09 couples for every 1,000 households, amounting to an impressive 162,914, while Washington has 11.88, amounting to 35,352.
New Mexico rounded out the top ten states same-sex couples choose to live in, with 11.47 couples for every 1,000 households, amounting to 9,517.
Central and Mountain states have the lowest proportion of same-sex couples
On the opposite end of the scale, the state with the lowest proportion of same-sex couples for every 1,000 households is North Dakota, which has 4.30 same-sex couples for every 1,000 households, amounting to 1,386. South Dakota follows behind, with 4.32 same-sex couples for every 1,000 households, amounting to 1,513.
Wyoming has 4.91 same-sex couples for every 1,000 households, amounting to 1,154, while Mississippi, which last year enforce a ban to prevent trans people from using the correct public bathrooms, has 5.13 same-sex couples for every 1,000 households, amounting to 5,937.
Montana, which this year banned Pride flags from government property and public schools, has 5.29 same-sex couples for every 1,000 households, totalling 2,370, while Idaho has has 5.59 same-sex couples for every 1,000 households, amounting to 3,783.
Nebraska has 5.81 same-sex couples for every 1,000 households, amounting to 4,495, while Alabama has 5.83, amounting to 11,737.
Iowa, where trans teen Kayde Martin spent his 18th birthday begging Iowa legislators not to take away his rights, has 5.92 same-sex couples for every 1,000 households, amounting to 7,623. Kansas fares a little better with 6.44 per 1,000 households, a total of 7,412.
Share your thoughts! Let us know in the comments below, and remember to keep the conversation respectful.