Census reveals which parts of England and Wales have most LGBTQ+ people
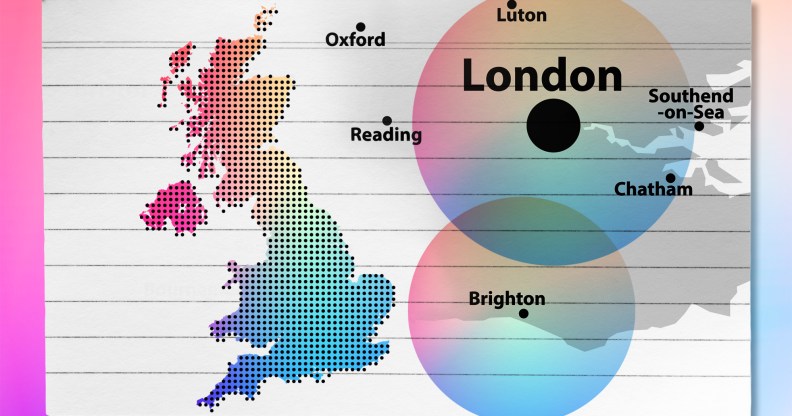
Kemptown in Brighton has one of the highest LGBTQ+ populations in England and Wales, according to Census 2021 data. (Getty)
Census data has revealed which parts of England and Wales that are home to the most and least queer people.
Released on Friday (6 January) the census revealed around 1.5 million people (3.2 per cent), of the 44.9 million aged 16 and over who answered, identified with an LGB+ orientation.
An Office for National Statistics map shows some surprising results, such as Central Exeter in Devon having a high LGBTQ+ occupation, with 10.3 per cent of its population identifying as LGB.
Central Bournemouth also comes up trumps as a queer-friendly place to live, with an 8.96 per cent LGB population, 8.59 living in East Cliff and 7.33 per cent in Westbourne.
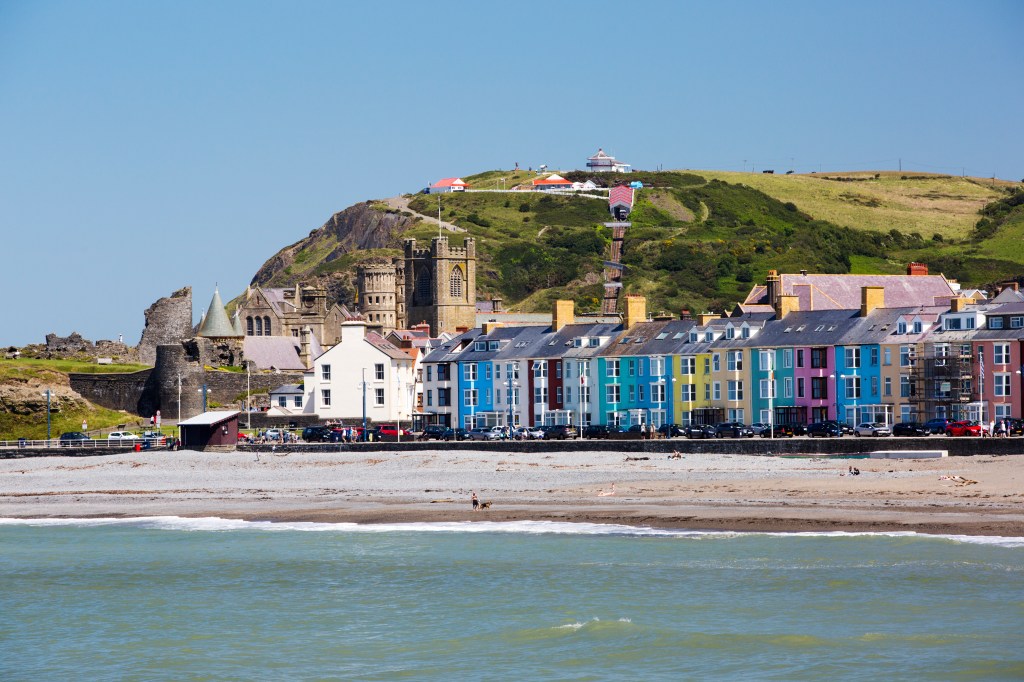
In Wales, Aberystwyth, a university town, is bursting with queer representation with an incredible 16.56 per cent of people living in Aberystwyth North saying they identify as LGB.
Reading has a much smaller LGBTQ+ presence at 4.17 per cent overall, with Central Reading scoring higher at 6.52 per cent and Wokingham Road being the place to be with 7.20 per cent.
Chatham in Kent has a much smaller gay community with Chatham Central being home to 5.49 per cent, while Southend-on-Sea also has a small community with an overall 3.23 per cent.
London is home to the most queer people who responded, with 12 per cent of people living in places such as Holborn, Oval and Vauxhall South saying they are LGB.
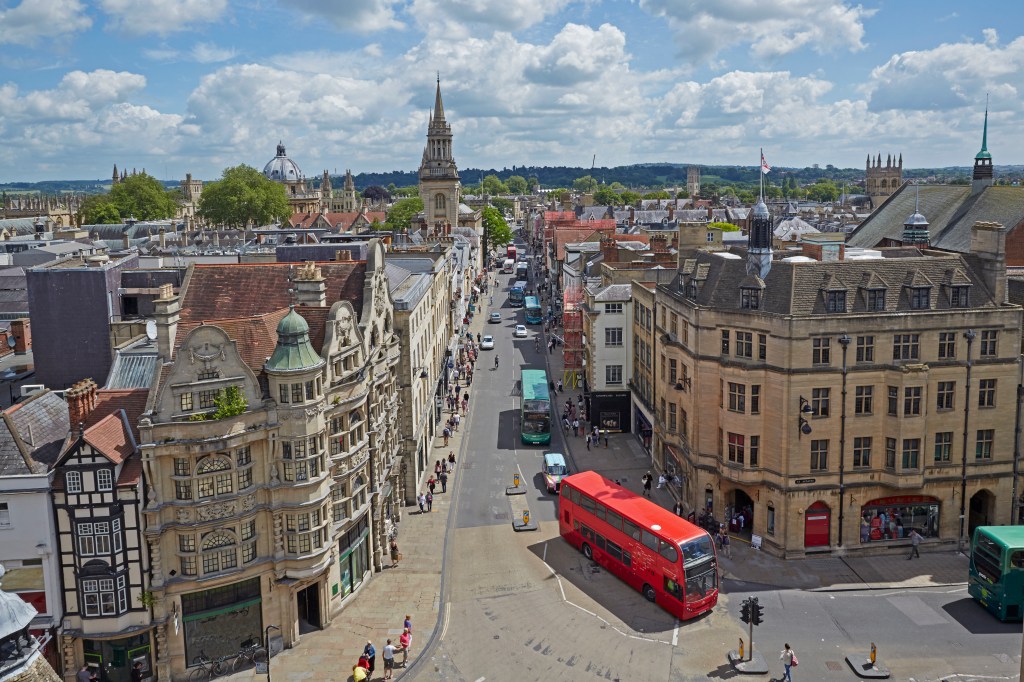
Similarly, 14.9 per cent of the population of the university city of Oxford Central confirmed likewise.
Areas such Radley, Wootton and Marcham have a much smaller number of LGBO (lesbian, gay, bisexual or other) community, with 2.19 per cent.
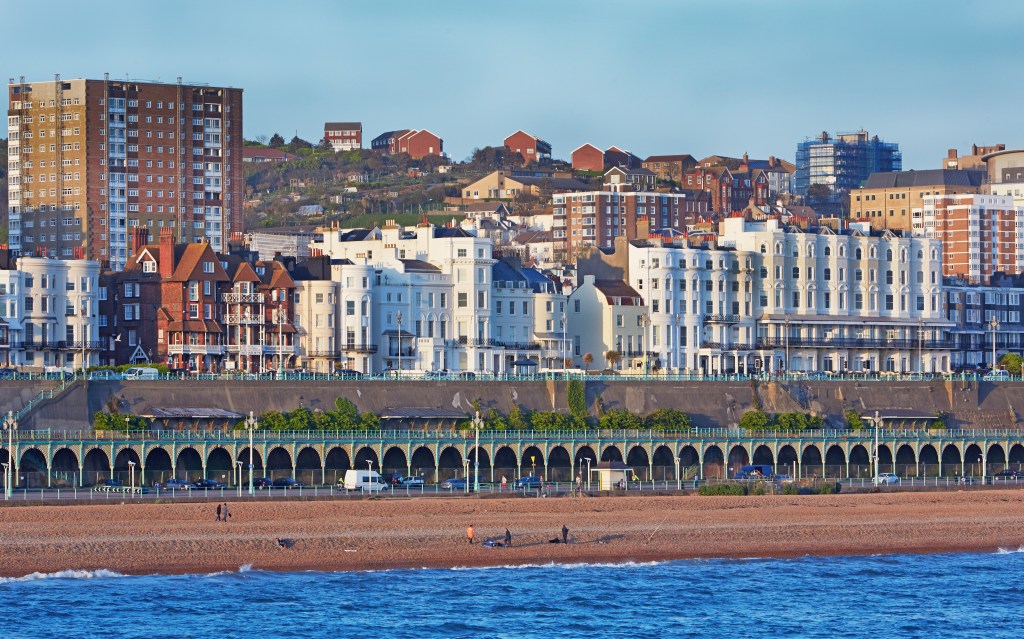
Brighton also ranks highly as a city home to the gay community, with an impressive 10.73 per cent confirming their LGB identity. Within the city, suburbs such as Round Hill are a haven with a huge 16.20 per cent, while Kemptown boasts a staggering 20.11 per cent.
The city of Canterbury, where Canterbury Christ Church University is based, has an overall low score of LGB people at 4.49 per cent. Although the central and Wesgate area score higher at 8.57 per cent.
Elsewhere in Cliftonville West, a costal area of the town Margate, the census recorded 7.09 per cent, while Worthing has an average of 7.08 per cent.
Manchester has an overall 6.67 per cent of LGBO people living there, with suburb Fallowfield Central having a high percentage of 13.75 per cent queer.
In Norwich City Centre West a 14.09 per cent score stands out, while Earlham Road and College Road is also highlighted with a 10.73 per cent gay population.
Lincoln has an overall LGB per cent of 6.34, with the Wharf and University boasting the highest 13.47 per cent.
Central Luton is home to only 4.99 per cent of the community, while North Norfolk resides 2.51 per cent of queer respondents.
Areas including Shropshire, East Suffolk and Wiltshire all had under 3 per cent of the queer community living there.
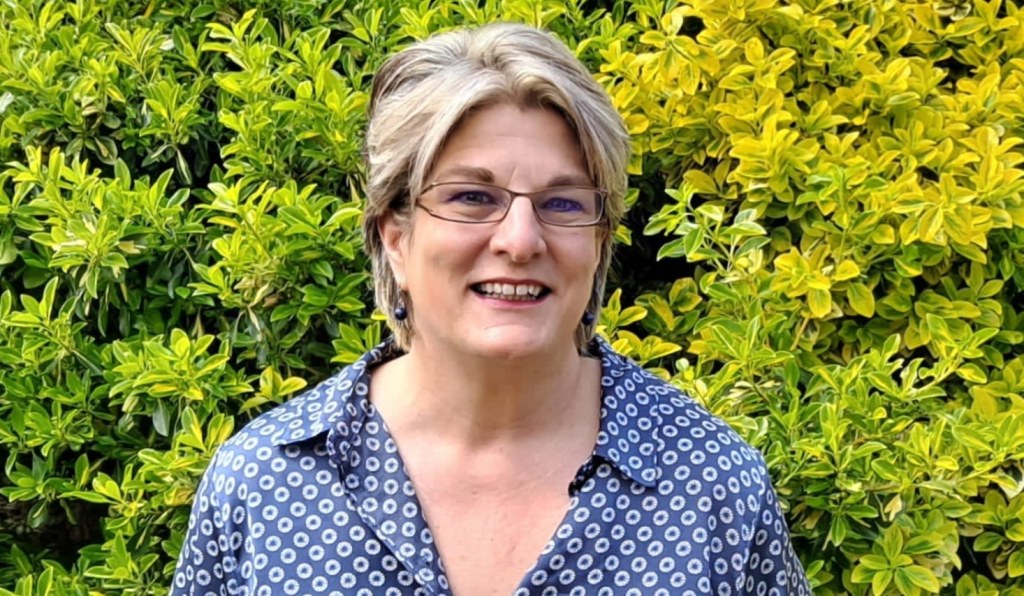
Conversion therapy survivor and founder of Ozanne Foundation, Jayne Ozanne told PinkNews she was “grateful” and “relieved” to have “a more accurate understanding of the numbers of LGBT+ people in England and Wales”.
“This has finally broken the old adage ‘if you’re not counted, you don’t count’ – indeed there is now no excuse for ignoring the needs of some of our most marginalised members of society.”
Ozanne hopes the new data will aid the government to “take more seriously its responsibilities to the LGBT+ community”.
“University towns like mine (Oxford) show far higher levels of LGBT+ people (also found in Cambridge), pointing to an explosion of younger people being able to be their true authentic selves – and be open about it.
“The sad truth though is that there is still a significant proportion of society who feel unable to share – even in a confidential survey – who they know themselves to be.”
ONS director Jen Woolford told PinkNews: “Having these first census estimates about the population [of England and Wales] in relation to gender identity, as well as sexual orientation at a local level, is crucial.
“They will ensure decision-makers have the best information so they can better understand the extent and nature of disadvantage which people may be experiencing in terms of educational outcomes, health, employment, and housing.”
The above percentages are based on around 1.5 million people (3.2 per cent) responding that they identified with an LGB+ orientation.
How did this story make you feel?

